008 2025-01-12
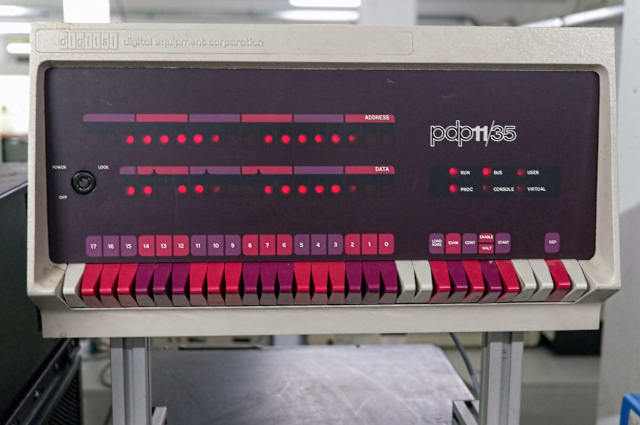
For the longest time, people and companies have used LED/lamp panels for displaying information pulled from a computer system. They're colloquially known as "blinkenlight consoles". One of the most famous is the PDP-11 from the 70s:

The PDP-11's panel was used for displaying on or off values (1s and 0s) of CPU registers, memory addresses, and other system functions based on the button and knob positions on the panel. Reading the values was never straightforward, but if you knew what to look for, you could quickly decipher what the computer behind the panel was actually doing.
I've always wanted my own personal LED panel for displaying a server's status, so this year I set out to start and complete a little weekend project: a tiny hardware-based server status visualizer.
The visualizer
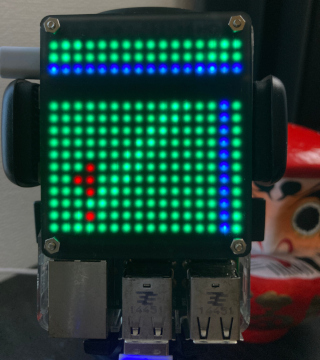
Here's a photo of the visualizer for GitHub's Statuspage, running on an old Raspberry Pi 2 B, taken sometime in December 2024:

It's more of a "website" status visualizer. A simple Python script fetches the information from one or more site's statuspage.io API, and creates a visual representation of the site's current and historical status for the previous two weeks. Once you know how to read the display, it only takes a second to visually process the information.
Requirements
As mentioned above, it's running on a Raspberry Pi, and the display is a Unicorn Hat HD, a 16x16 LED matrix which mounts directly to the Pi.
The OS installed on the Pi is the standard headless (no desktop) RaspiOS, which includes Python 3.9 as well as a few other tools and configuration settings (example: SPI mode enabled).
How to read the matrix
The following is borrowed from the project's README:
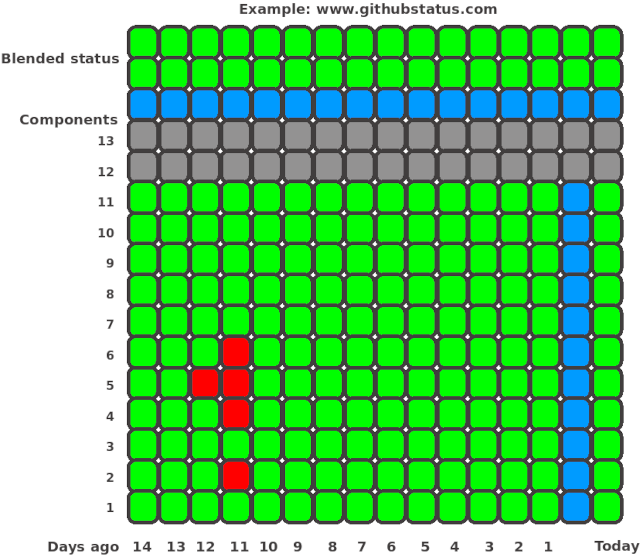
Here we'll use an example from githubstatus.com:

First, most importantly: The blue lines are dividers
Above the blue line
The 2x16 dots (32 dots) above the horizontal blue line represent the blended status, as explained here. Those dots will always appear either red, orange, yellow, or green at the same time. This makes it very clear when a global outage or incident is currently in effect.
Right of the blue line
Next, the 11 dots to the right of the vertical blue line represent today's status impact of each individual component, as explained here. Each component is given one row of dots starting from the bottom. Each dot can appear either red, orange, yellow, or green independently.
A maximum of 13 components can be displayed at once, so the program will only display the first 13 components returned by the Statuspage v2 API.
Left of the blue line
Finally, the dots to the left of the vertical blue line represent the historical status impact of each individual component. The dot immediately to the left of the vertical blue line is the status from 1 day ago. The second dot to the left of the vertical blue line is the status from 2 days ago, etc.
A maximum of 14 days worth of historical status can be displayed at once.
Below the blue line
The black dots/spaces below the horizontal blue line represent no component and therefore have no status dots and no dividing line (i.e: no blue dot).
Interpreting githubstatus.com
From the example above, we can conclude the following:
- All systems are currently operational (blended status)
- All 11 components are operational today
- Components 2, 4, 5, 6 had a major outage 11 days ago
- Component 5 had a major outage 12 days ago
Getting started
If you already have the hardware, then you can follow the most up-to-date instructions in the README to get up and running.
Once the repo is cloned and the software/dependencies are installed, you just need to run the script with root privileges, for example:
sudo ./statuspage.py "www.githubstatus.com www.37status.com"
This will fetch the status of each website, alternating every 60 seconds. I'll explain how it works below (also borrowed from the project's README):
How it works
Here's some output for GitHub's statuspage, taken January 12, 2024:
sudo python3 ./statuspage.py www.githubstatus.comStatusPage: www.githubstatus.com
Summary status age: 0 seconds
Blended status: All Systems Operational
Today's status for component 1 - operational - Git Operations
Today's status for component 2 - operational - Webhooks
Today's status for component 3 - operational - Visit www.githubstatus.com for more information
Today's status for component 4 - operational - API Requests
Today's status for component 5 - operational - Issues
Today's status for component 6 - operational - Pull Requests
Today's status for component 7 - operational - Actions
Today's status for component 8 - operational - Packages
Today's status for component 9 - operational - Pages
Today's status for component 10 - operational - Codespaces
Today's status for component 11 - operational - Copilot
Incident (major) on 2025-01-11T00:45:23.845Z : 2 days ago for component 1: Git Operations
Incident (major) on 2025-01-11T00:45:23.845Z : 2 days ago for component 2: Webhooks
Incident (major) on 2025-01-11T00:45:23.845Z : 2 days ago for component 4: API Requests
Incident (major) on 2025-01-11T00:45:23.845Z : 2 days ago for component 5: Issues
Incident (major) on 2025-01-11T00:45:23.845Z : 2 days ago for component 6: Pull Requests
Incident (major) on 2025-01-11T00:45:23.845Z : 2 days ago for component 7: Actions
Incident (major) on 2025-01-11T00:45:23.845Z : 2 days ago for component 9: Pages
Incident (major) on 2025-01-11T00:45:23.845Z : 2 days ago for component 10: Codespaces
Incident (major) on 2025-01-11T00:45:23.845Z : 2 days ago for component 11: Copilot
Incident (minor) on 2025-01-10T01:11:29.417Z : 3 days ago for component 2: Webhooks
Incident (minor) on 2025-01-10T01:11:29.417Z : 3 days ago for component 5: Issues
Incident (minor) on 2025-01-10T01:11:29.417Z : 3 days ago for component 7: Actions
Incident (minor) on 2025-01-09T08:30:41.701Z : 3 days ago for component 7: Actions
Incident (minor) on 2025-01-06T23:30:24.893Z : 6 days ago for component 6: Pull Requests
Incident (minor) on 2025-01-06T23:30:24.893Z : 6 days ago for component 7: Actions
I guess they've been busy...
How the script works
The script will run in an infinite loop, fetching status updates of one URL, then it will sleep for 60 seconds (SLEEP_TIMEOUT variable) before fetching the status updates of the next URL.
It will first fetch the summary from the summary.json URL to obtain the blended status of the site. It will cache the results in a temporary file in /tmp (FILE_PREFIX variable), and then update the current site status (above the horizontal blue line).
If the temporary file exists, it will check its age and use the existing file if it's less than 1 hour old (MAX_AGE_SUMMARY constant).
If the blended status is more than 5 minutes old (MAX_AGE_STATUS constant), it will fetch a new status from the status.json URL.
The summary data will then be used to update today's component status (right of the vertical blue line).
Next, the script will fetch the historical incident data from the incidents.json URL and update the historical component status (left of the vertical blue line). Similar to the summary.json, the file will be cached in a temporary location, but this time for up to 24 hours (MAX_AGE_INCIDENT constant). This is to prevent constantly hitting the API to obtain historical data that technically shouldn't change (unless someone has a time machine...).
Final notes
Of course, the entire thing is Open Source (MIT License) so you're free to look at the source code and modify it as you wish.
I have it running 24/7 for a handful of websites and it's quite fun to see the status update in near real-time (even though I can't always do anything about it haha).
There are probably ways to tweak this for other LED matrices which don't rely on the Pi or the Unicorn HAT. Unfortunately these are the only devices I had on hand when I wrote this, and it was the quickest way to get going.
I would be super happy to accept pull-requests which add support for other hardware, but as a weekend project, I most likely won't publish any future/feature updates of my own creation.
https://blog.a1w.ca/p/2025-01-12-weekend-project-server-status-visualizer2025-01-12 12:00:00 UTC